Work / Analytics & Risk Modeling
PhillyCycle Rental Analytics
An analysis of nearly half a million bike rentals to explain ridership patterns, test hypotheses, and identify operating implications across customer segments and seasons.
- Role
- Data analyst and presenter
- Context
- Academic case
- Team
- Project team
- Deliverable
- Analytics case + data workbook
Summary
The question
A large rental dataset contained obvious seasonality but no single explanation for when, why, and by whom the system was used. The goal was to find insights that could support planning rather than simply describe the past.
What I did
- Cleaned and segmented the rental history by rider type, season, temperature, and weekday versus weekend behavior.
- Used hypothesis tests to distinguish meaningful differences from visual patterns and built a regression model around the strongest demand driver.
- Presented the findings as operational implications for capacity, timing, and customer strategy.
What it showed
The useful story was not simply that demand rises with temperature; it was how season, rider type, and calendar behavior combine to shape operating decisions.
From the work
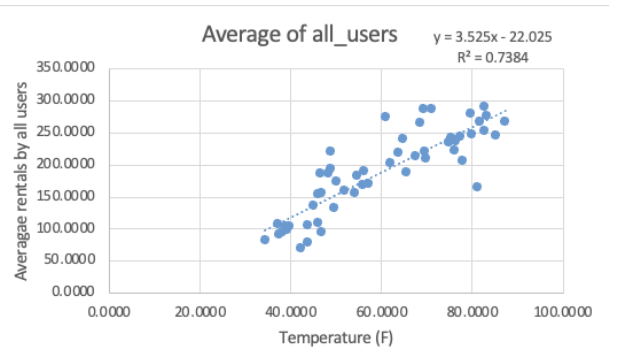
The R² value in this situation is very high (.74), which points to a very high correlation between an increase in temperature and an increase in the number of average rentals. When interpreting the regression equation, the coefficient 3.525 means that for every one degree increase in temperature, a 3.53 increase in bike rentals can be expected.
PhillyCycle analysis report
Charts and slides
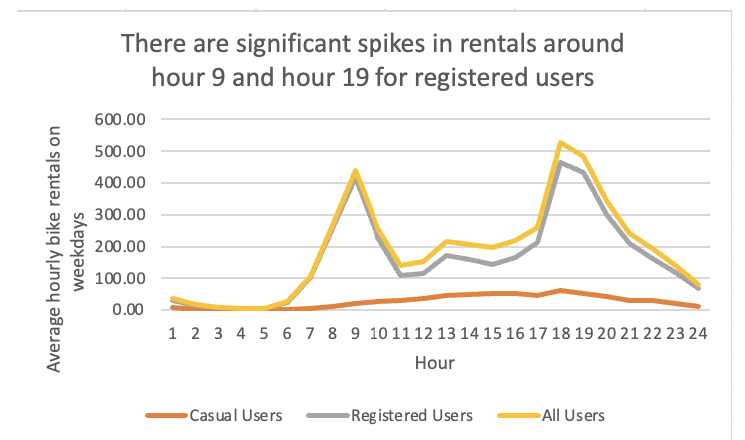
| Casual riders | Registered riders | |
|---|---|---|
| Average | 36.3 | 154.6 |
| Median | 16 | 116 |
| Standard deviation | 50.4 | 153.6 |
| Share of all 494,095 rentals | 19% | 81% |
In my words
This was one of several case-based projects from my business analytics coursework, where I used data to identify patterns and translate them into operating recommendations. I enjoyed the classes enough that I later became a tutor for the business analytics sequence, which helped reinforce both the technical concepts and how to explain them clearly.
Documents
- PhillyCycle analysis reportPDF · 13 pages · Excel data available